Revenue per Employee Analysis - 2022
In this article, we will discuss
What is Revenue per Employee metric?
How has the pandemic impacted the revenue per employee metric?
How much an average employee contributes to in some of the popular companies.
Important Things to consider when making conclusions based on Revenue per Employee metric.
1. What is Revenue per Employee?
Revenue per Employee metric is a useful metric to measure average contribution of employees towards the company’s revenue. It measures the production value of an average employee in the company.
It is calculated as
(Revenue / Number of Employees)
So, whether the metric increases or decreases in value will depend on what happens to the two components: Revenue and Headcount, its direction (increase or decrease) and magnitude (How much).
2. Impact of Pandemic on Revenue per Employee
Let’s see how the pandemic has changed the revenue per metric employee for some of the companies in the technology industry.
Source:
Data used here comes from Tradingview.com. They source the data from earnings reports available in public from these companies.
Important Note:
Please note that data and analysis are based on last available earnings reports: Apple (Sep 2022), Starbucks (Sep 2022) and Microsoft (June 2022), Salesforce (Jan 2023) and all other companies (Dec 2022). Workforce reductions announced in late 2022 are mostly going to impact 2023 numbers and hence not reflected here.
Revenue per Employee Change 2022 vs 2018
The chart below shows how the revenue has grown and the headcount has grown.
Revenue and Headcount growth in 2022 vs 2018
Here are 5 observations that stood out to me.
1. Declining Revenue per employee for Meta and Amazon
Meta and Amazon hired at a higher rate than their revenues grew. Hence the revenue per employee declined.
Amazon and Meta had higher headcount growth than revenue growth
Though Meta and Amazon appear to be similar in reduced revenue per employee, the underlying patterns could be different.
Meta/Facebook
It’s more about declined revenue.
Just like many tech companies, revenue spiked (37%) in 2021 but unable to increase revenue in 2022.
Meta’s revenue decline in 2022
However, employee growth continued.
Meta - Employee Growth continued in 2022
Employee growth is not unusually high by any standards; however, the revenue decline is the reason for the drop in revenue per employee. Work reduction is happening in 2023.
Meta - Revenue per Employee trend 2016 to 2022
Amazon
It was more of the employee growth being higher than revenue growth. 2020 was huge in revenue (38%) but employee growth (63%) was significantly higher.
Amazon - 2020 increase in 2022 decrease
When Revenue growth (9.4%) slowed in 2022, Amazon reduced its workforce in 2022 (vs 2021), increasing the revenue per employee despite slowing revenue growth.
2. Apple’s 19% improvement in revenue per employee
From 2018 to 2022, Apple had the lowest revenue growth of 48%, but increased their workforce only by 24% thus improving their revenue per employee significantly (19%)
Apple - Revenue per Employee trend from 2016 to 2022
Apple did not make any major hiring spikes.
Apple - Revenue Growth and Headcount Growth 2016 to 2022
There was a revenue spike in revenue in 2021 (33%). However, the employee growth is steady without any major peaks.
This leads to a healthy revenue per employee retained in 2022 after the big increase in 2021.
3. Salesforce’s increase in revenue per employee despite high headcount growth
Despite their high employee growth (127%), Salesforce managed to increase their revenue per employee, due to the high revenue growth (136%)
Salesforce - Revenue Growth and Employee Growth 2016 to 2022
Salesforce has had very good (mid-20%) growth in revenue until 2021 and though it slightly reduced in 2022, it was still a healthy 18%.
They have had spikes in employees, once in 2019 and then in 2021. On both occasions, their revenue per employee declined. However, they grew their headcount by only 8% in 2022, which helped in improving their revenue per employee metric. They have announced workforce reduction now for 2023.
4. Alphabet and Netflix doubling their revenue and increasing their headcount significantly.
ALPHABET
Alphabet - Revenue Growth & Number of Employees Growth from 2016 to 2022
Alphabet - Big spike (41%) in revenue in 2021 which led to an increase in Revenue per Employee. The increases in employee count has not been unusual.
Revenue growth slowing down in 2022 has led to a decline in revenue per employee. It is to be noted that revenue per employee is still healthier than it was before the pandemic. The company has announced workforce reduction in 2023.
Alphabet / Google - Revenue per Employee Trend from 2016 to 2022
NETFLIX
Netflix - Revenue and Headcount - 2016 to 2022
Revenue growth was steady until 2021 and then slowed down a lot (6.5%) in 2022.
Employee growth slowed in 2020 that led to an increase in revenue per employee in 2020. There has been no unusual spike in employee growth in last few years.
Revenue growth slowing down in 2022 has led to a decline in revenue per employee. It is to be noted that revenue per employee is still healthier than it was before the pandemic.
5. No spikes in Microsoft’s revenue growth
Revenue Growth has been less overall compared to most of these companies, however they also didn’t increase their employee base as much as these other companies. Thus, their revenue per employee still grew after pandemic (2022 vs 2018).
Microsoft - Revenue per Employee metric trend 2016 to 2022
Microsoft had very steady revenue growth. While other companies increased revenue in 2021 followed by slowing down in 2022, Microsoft increased their revenue in 2022. But they didn’t have the spike in 2021 like others.
Microsoft - Revenue and Employee Growth 2016 to 2022
Very steady in employee growth but increased in 2022 (July 2021 to June 2022) period. 22% increase in employees which reduced the revenue per employee slightly for that period. They are going through workforce reduction now.
How much does an average employee contribute to company revenue?
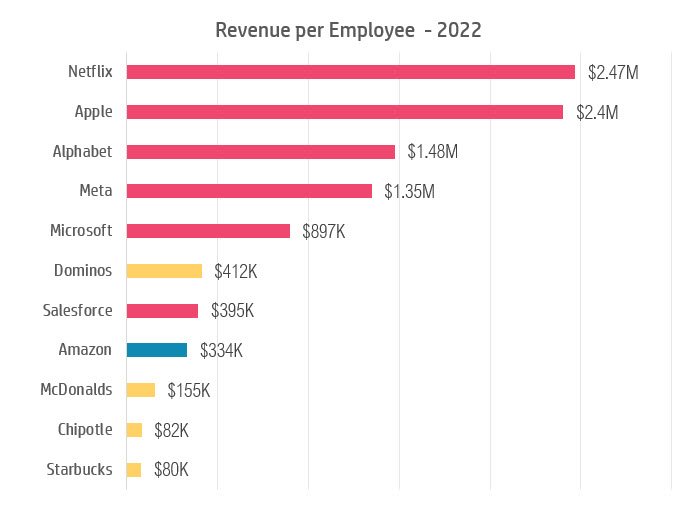
Revenue per Employee based on 2022 Earnings Reports
An average Netflix employee contributes $.247 Million to the company, while an average Microsoft employee contributes $897,000.
I have added some companies from the Food services industry for comparison. An average Starbucks employee contributes $80,000 to the company.
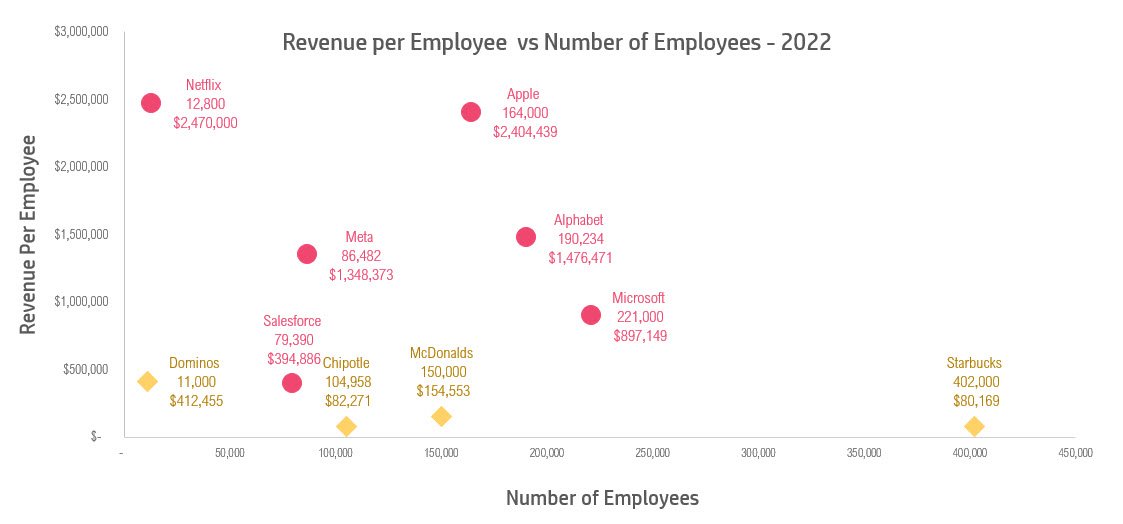
Revenue per Employee vs Number of Employees - 2022 Earnings Reports
Now you can see where the companies stand when it comes to number of employees and Revenue per employee.
Important Considerations when using Revenue per Employee metric
Not to be used alone
Revenue per Employee metric is a useful metric, however you should not come to any conclusions purely just based on this one metric. You need to consider other factors.
Cost is not part of the revenue per employee metric.
For example, there could be cost of goods sold which could be a major component in retail businesses. There could be real estate expenses which play a big role in businesses which rely on their physical stores. The human resource expenses (salaries) can be higher for technology companies. So, Profit per Employee should be measured as well.
2. Consider Company Strategy
When comparing your annual trend of revenue per employee, we must consider our company’s strategy in the context.
Reduced revenue per employee is not necessarily a bad thing in some scenarios.
For example, you invest money in your employee base to drive your revenue growth in future via new products and services. During the growth phase of a new company, this revenue per employee metric could be lower. Investment in more employees can lead to improved revenue in future.
Hence, the strategic context needs to be taken into account.
3. Consider Industry and Business Models
When comparing the metric with other companies, we have to make sure that they are comparable companies.
They need to be in the same market (products, services, geography). For example, Food services industry will have a completely different range of revenue per employee. The type and skills of employee mix in that industry will be different from other industries.
Companies like Amazon which are in several industries can be hard to compare against.
Even within the industry, the business models can be different. In the food services industry, McDonalds and Dominos are more franchise stores-focused while Chipotle and Starbucks are company owned store focused business models. Depending on what % of your business is franchise stores, the revenue per employee could change significantly.
So comparisons have to be made keeping the business model in mind.
Now, it’s your turn
How do you use Revenue per employee metric? Do you have any suggestions? I look forward to learning from you.


